NAD+


NAD+ is a molecule found in cells that helps them produce energy and supports processes involved in responding to DNA damage. DeSoto Peptides supplies NAD+ as a lyophilized research material and is developing batch-specific documentation to support verification.

Digital illustration of a small medicine vial with a blue cap and a blue cross on the label.

500/1000MG PER VIAL

Lyophilized research material

Neon style illustration of a microscope.

RESEARCH GRADE

Lot-specific documentation available

A blue and white shield with a checkmark in the center, symbolizing security or protection.

BATCH VERIFIED

For laboratory research only

ONE MOLECULE. MULTIPLE CELLULAR ROLES.

A FOUNDATION OF CELLULAR RESEARCH

NAD+ is present in every living cell. Researchers study how it helps cells convert nutrients into energy and supports enzymes involved in DNA damage response and cellular signaling.
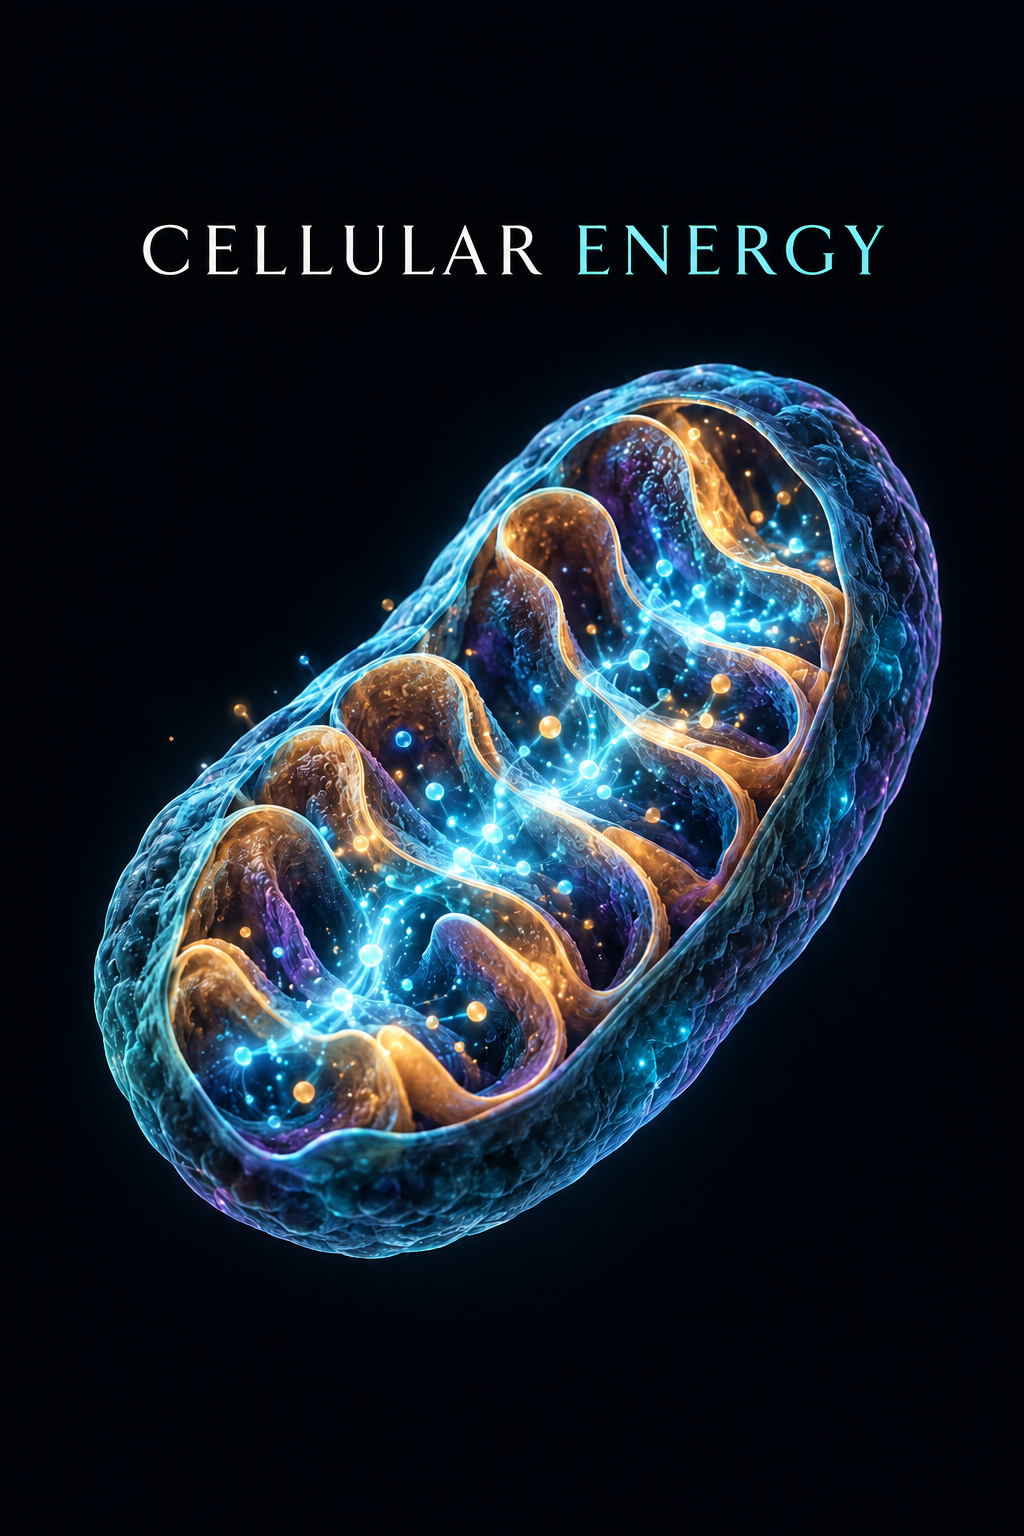
A digital illustration of a mitochondrion with glowing blue and orange energy pathways inside, representing cellular energy.

Helps cells convert nutrients into usable energy.
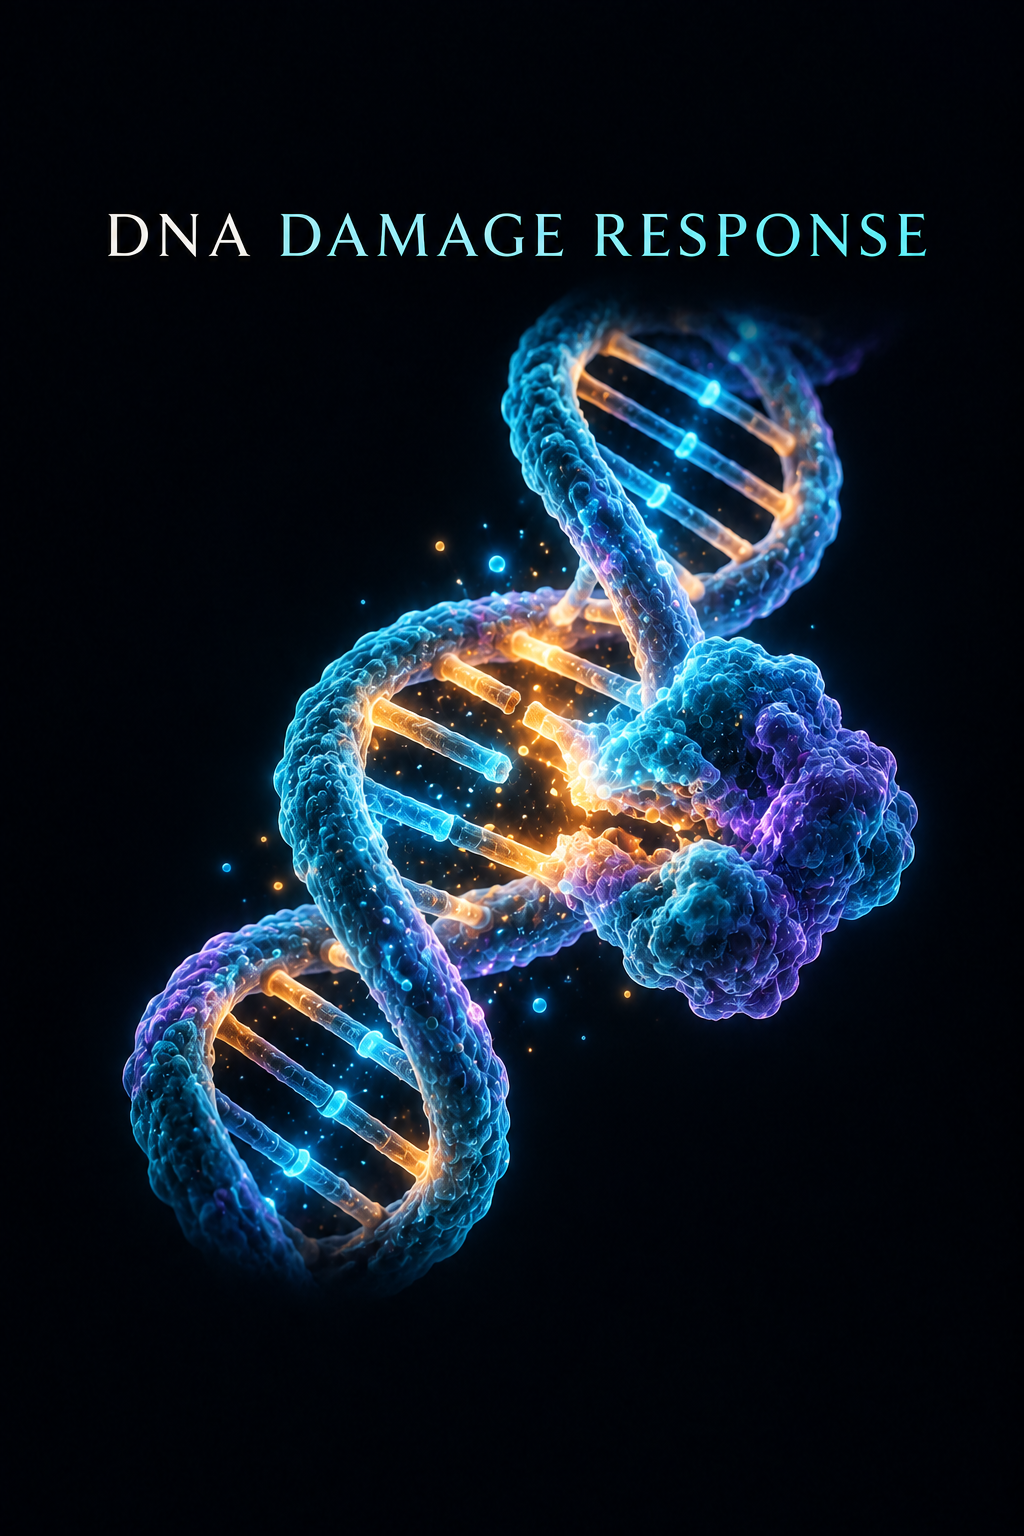
Digital illustration of a DNA double helix with glowing blue, purple, and orange colors, against a black background, with the text 'DNA Damage Response' at the top.

Used by enzymes that respond to damaged DNA.
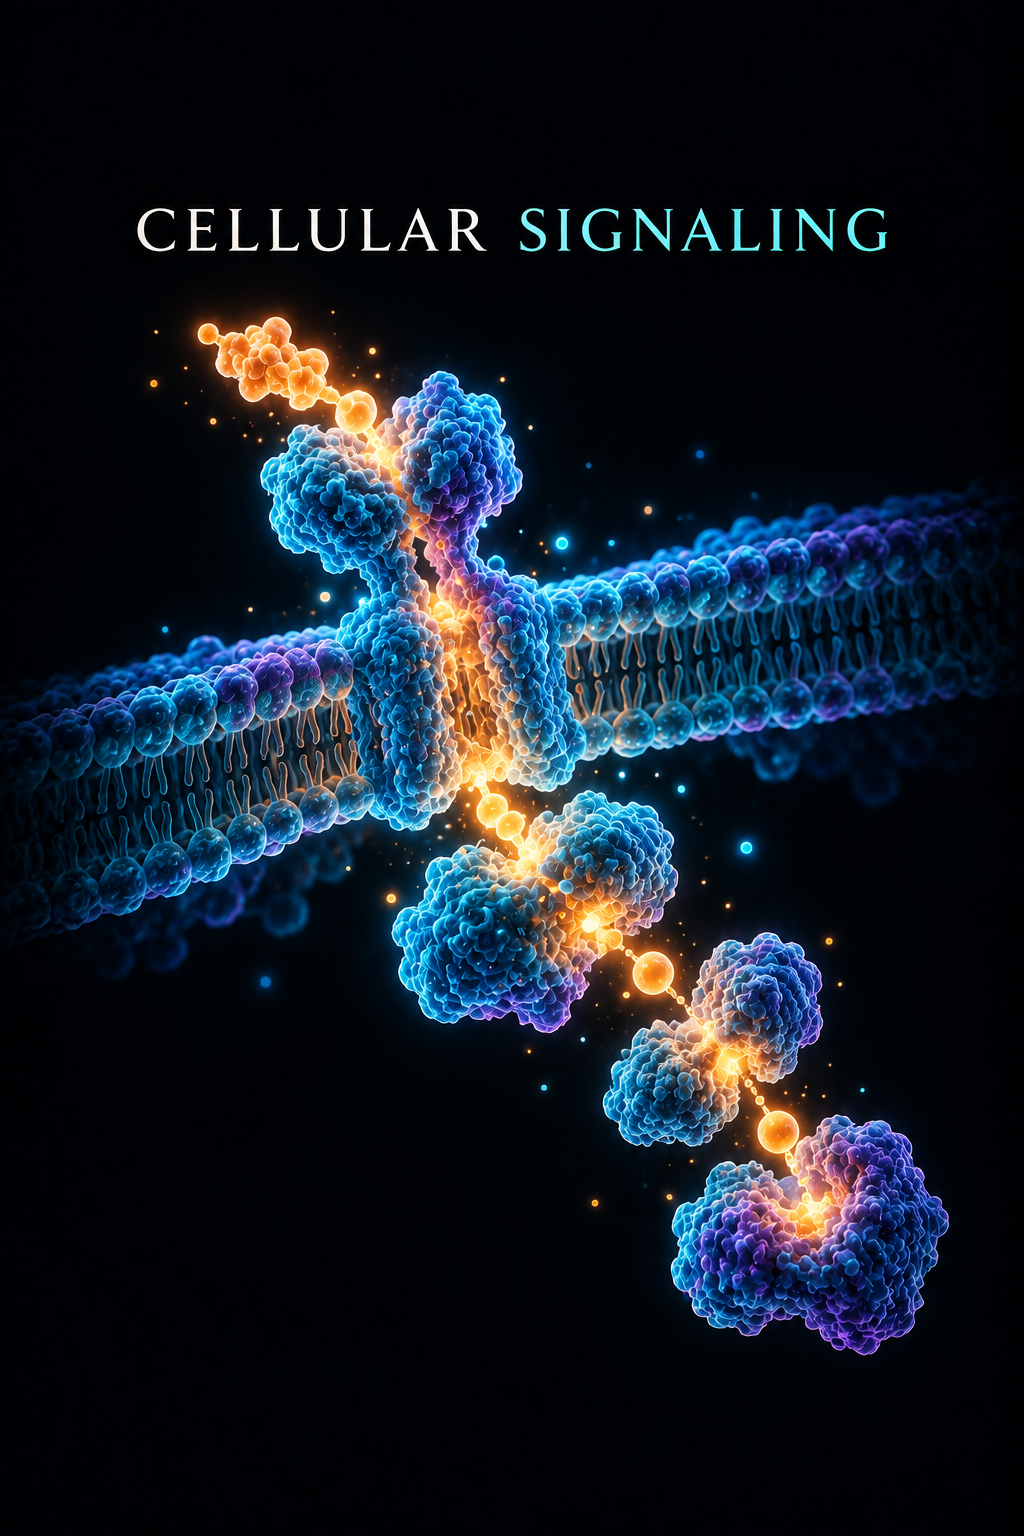
Digital illustration of a DNA strand with molecular signaling events highlighted, related to cellular signaling.

Supports enzymes that help regulate how cells respond to stress.

WHAT THE RESEARCH SHOWS

NAD+ is essential to how cells produce energy and use enzymes involved in responding to DNA damage. Researchers have also measured what happens to NAD+ in the blood after it is administered directly.

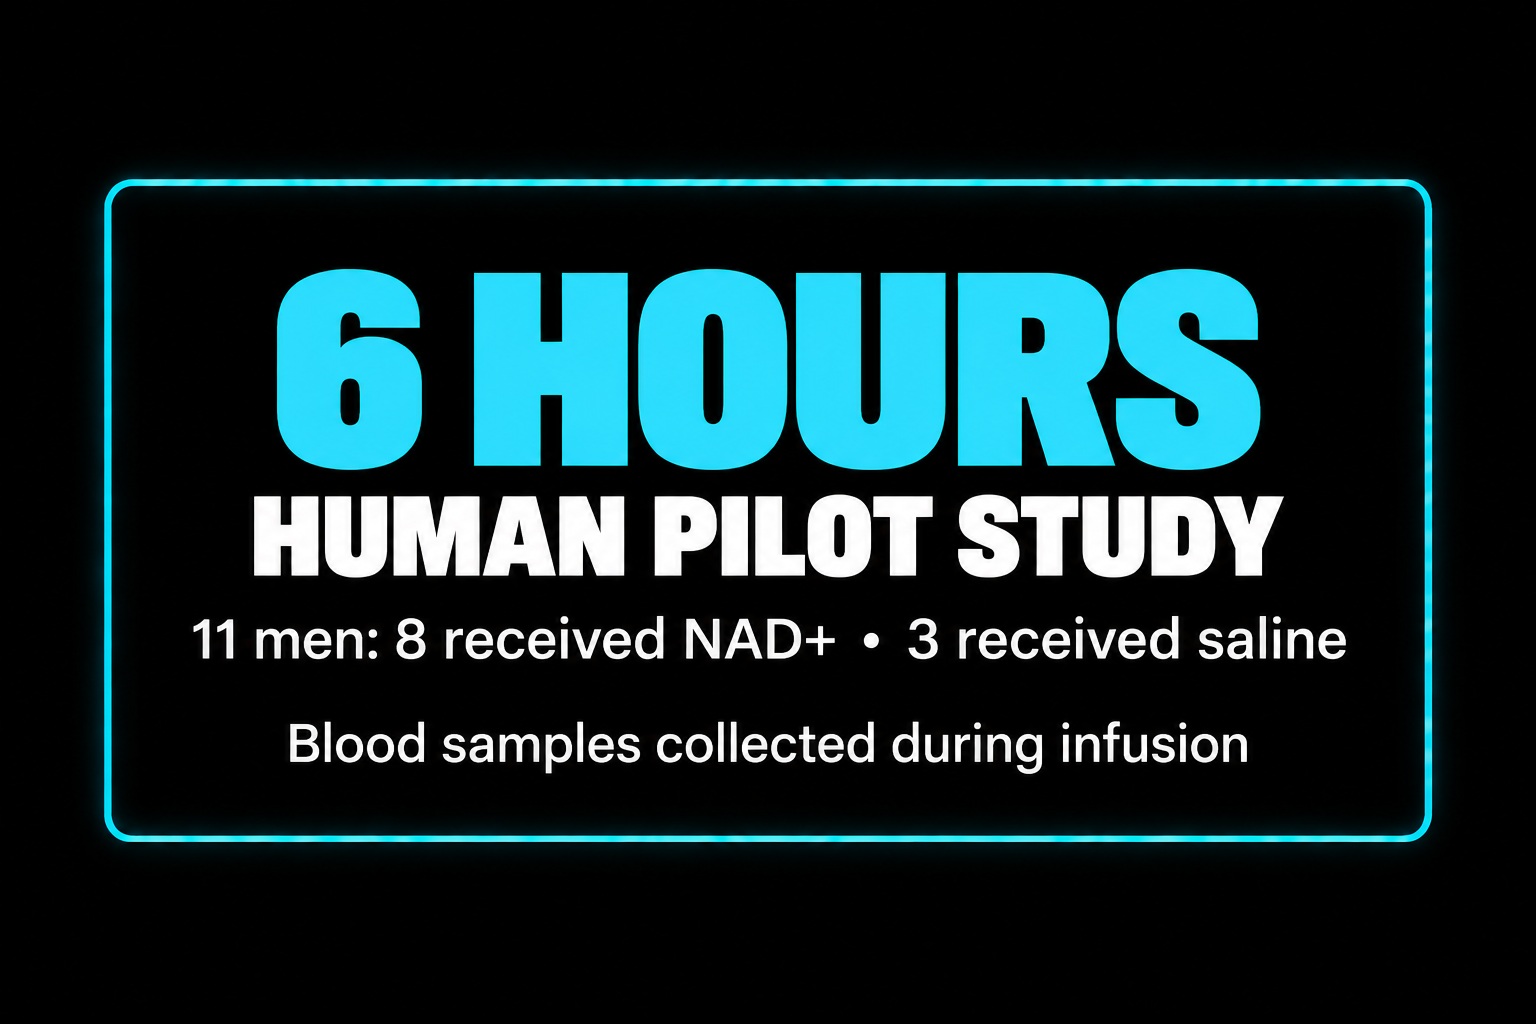
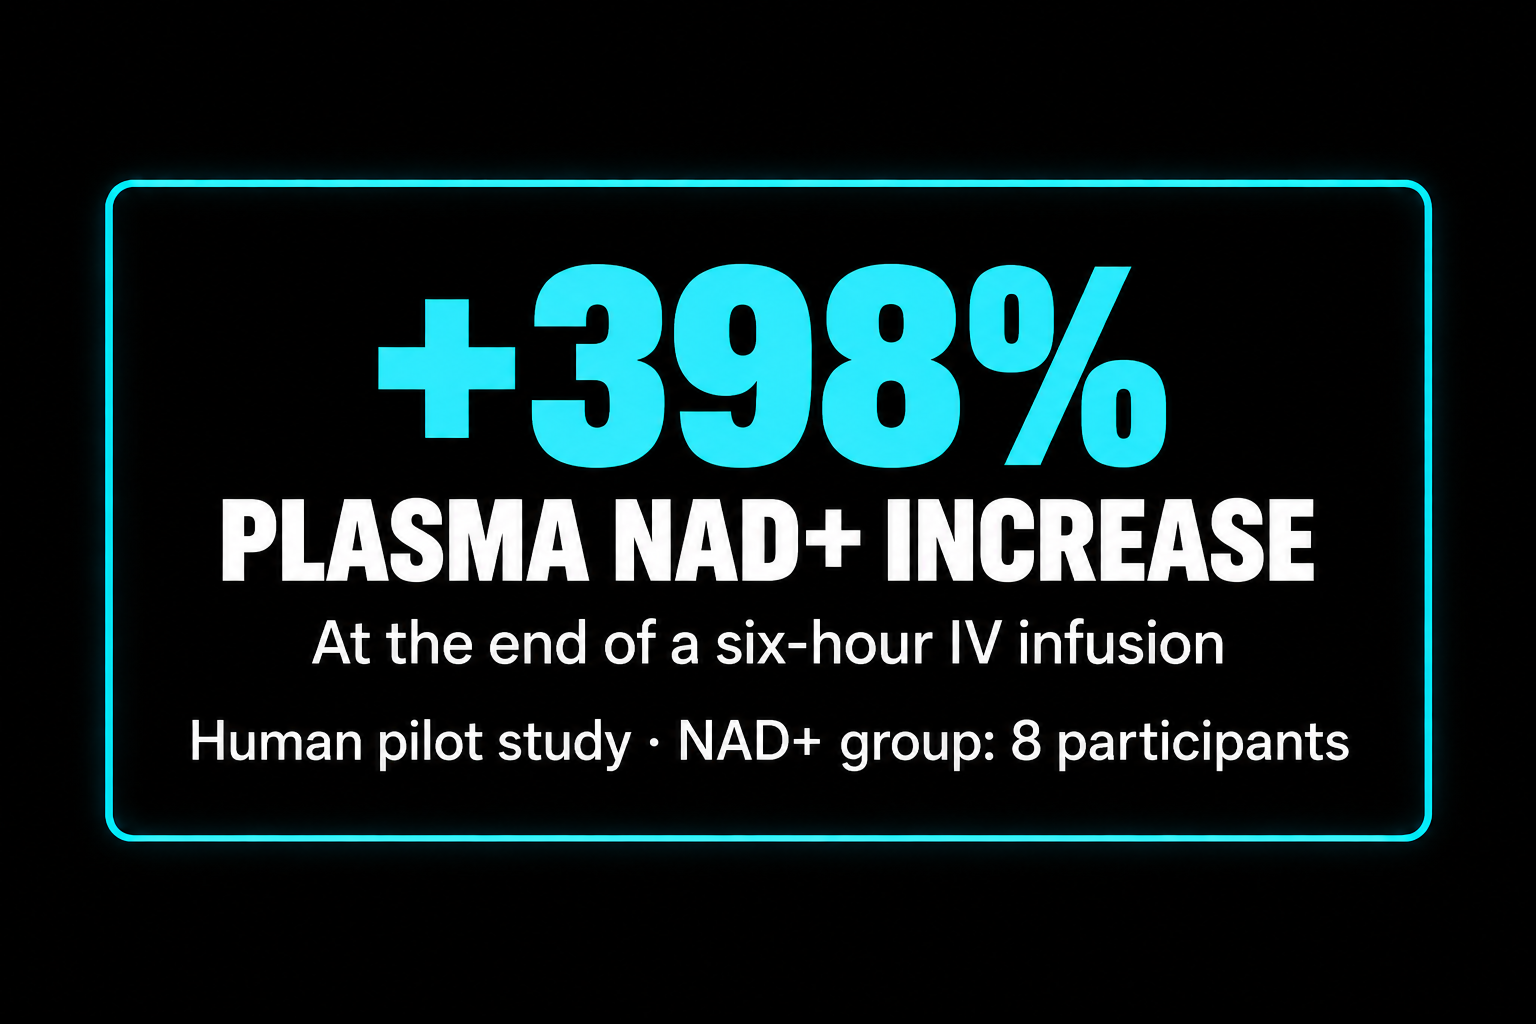
In a small study of 11 healthy men, eight received NAD+ by IV and three received saline. Blood NAD+ did not rise significantly during the first two hours of infusion. By the end of the six-hour infusion, the NAD+ group’s plasma levels had risen 398% above baseline. This study measured NAD+ in blood; it did not test whether participants felt better or had improved health outcomes.
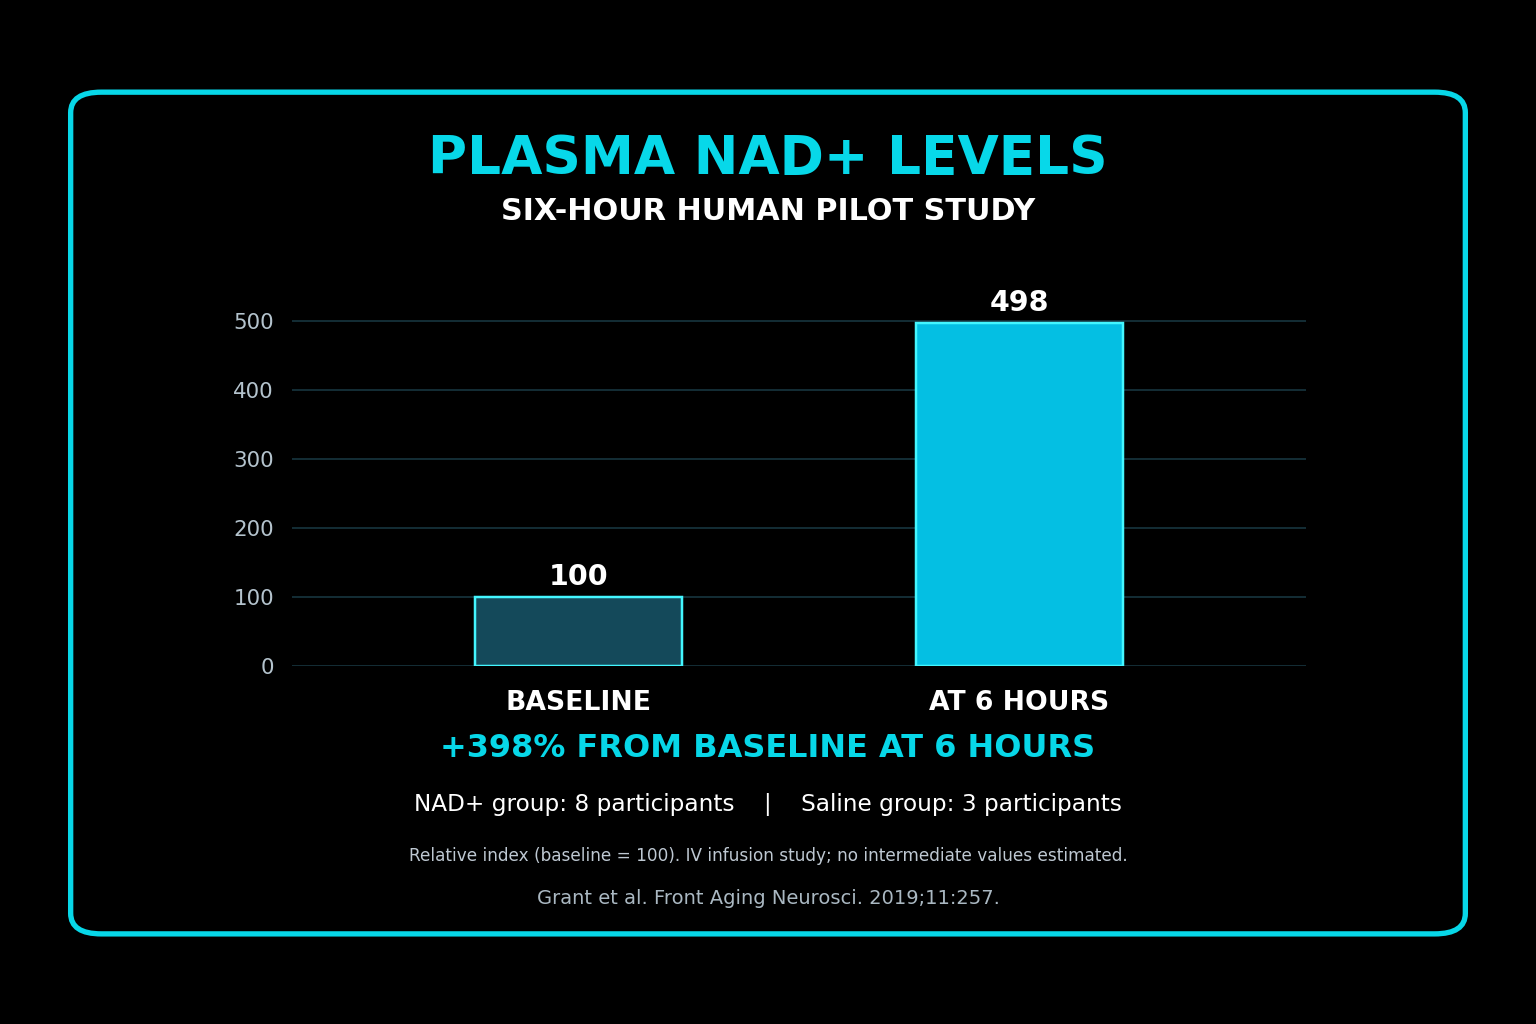
Bar graph illustrating plasma NAD+ levels in a six-hour human pilot study. The baseline level is 100, while the level after six hours is 498, indicating a 398% increase. Study involved 8 NAD+ participants and 3 saline participants. Data sourced from a 2019 scientific paper.
Digital display with text showing a 39% increase in plasma NAD+ levels after a six-hour IV infusion in a human pilot study with 8 participants, with a glowing blue border.
Neon sign displaying details of a 6-hour human pilot study, indicating 11 men participated, 8 received NAD+ and 3 received saline, with blood samples collected during infusion.
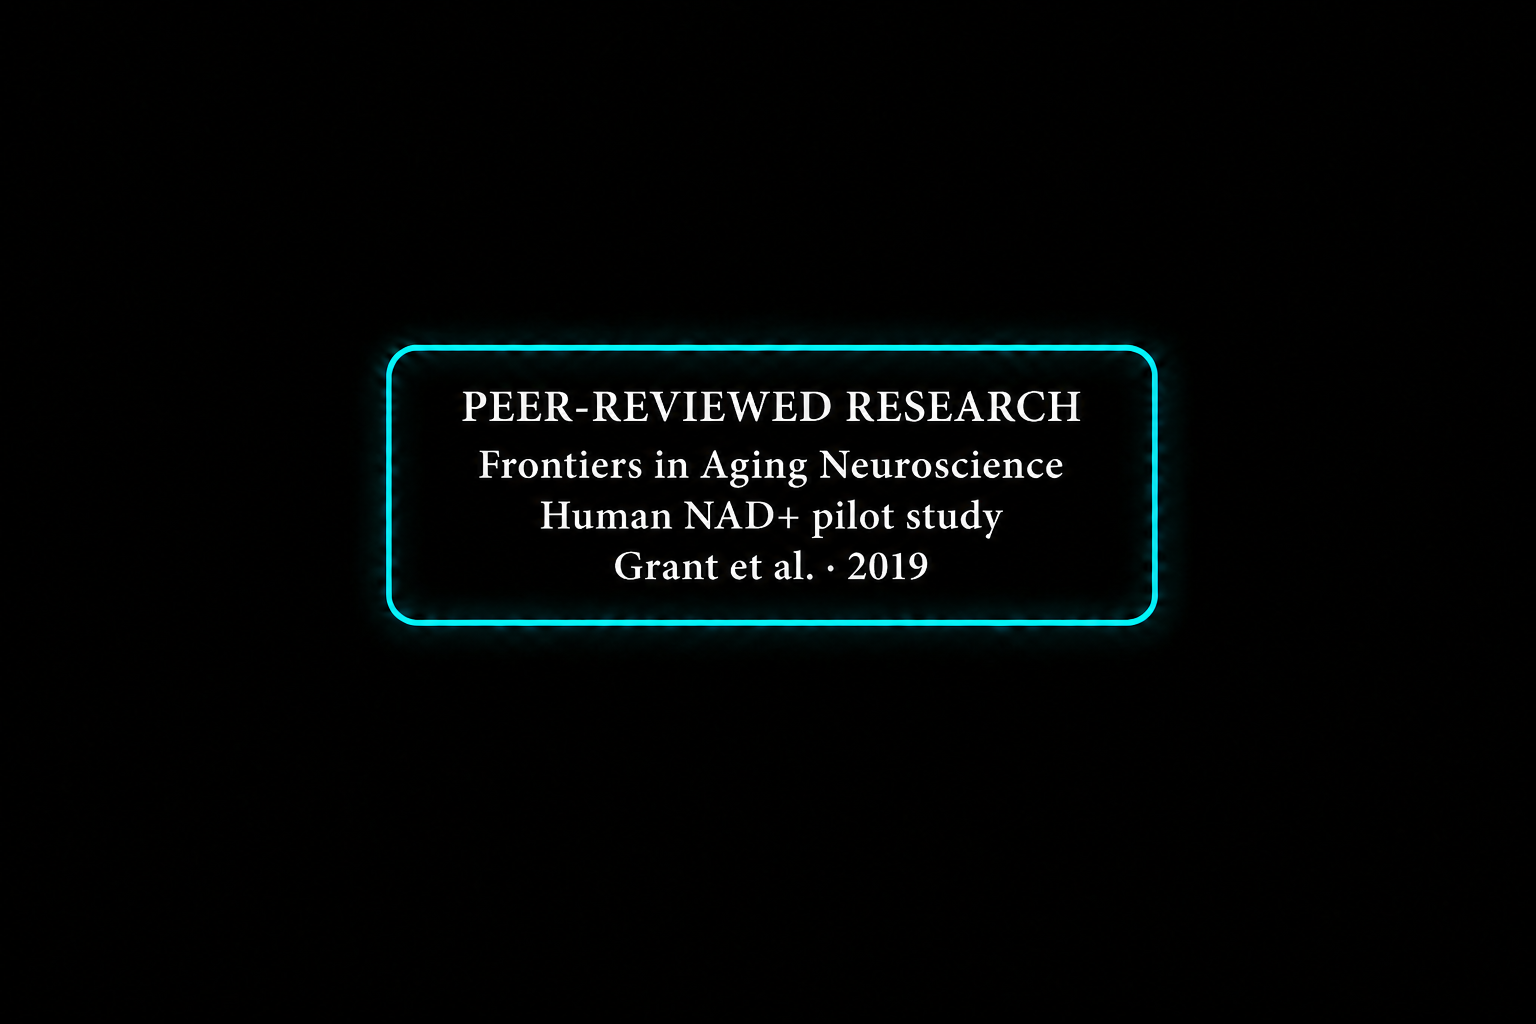
Neon sign displaying research details about aging neuroscience and human NAD+ pilot study, authored by Grant et al., 2019.
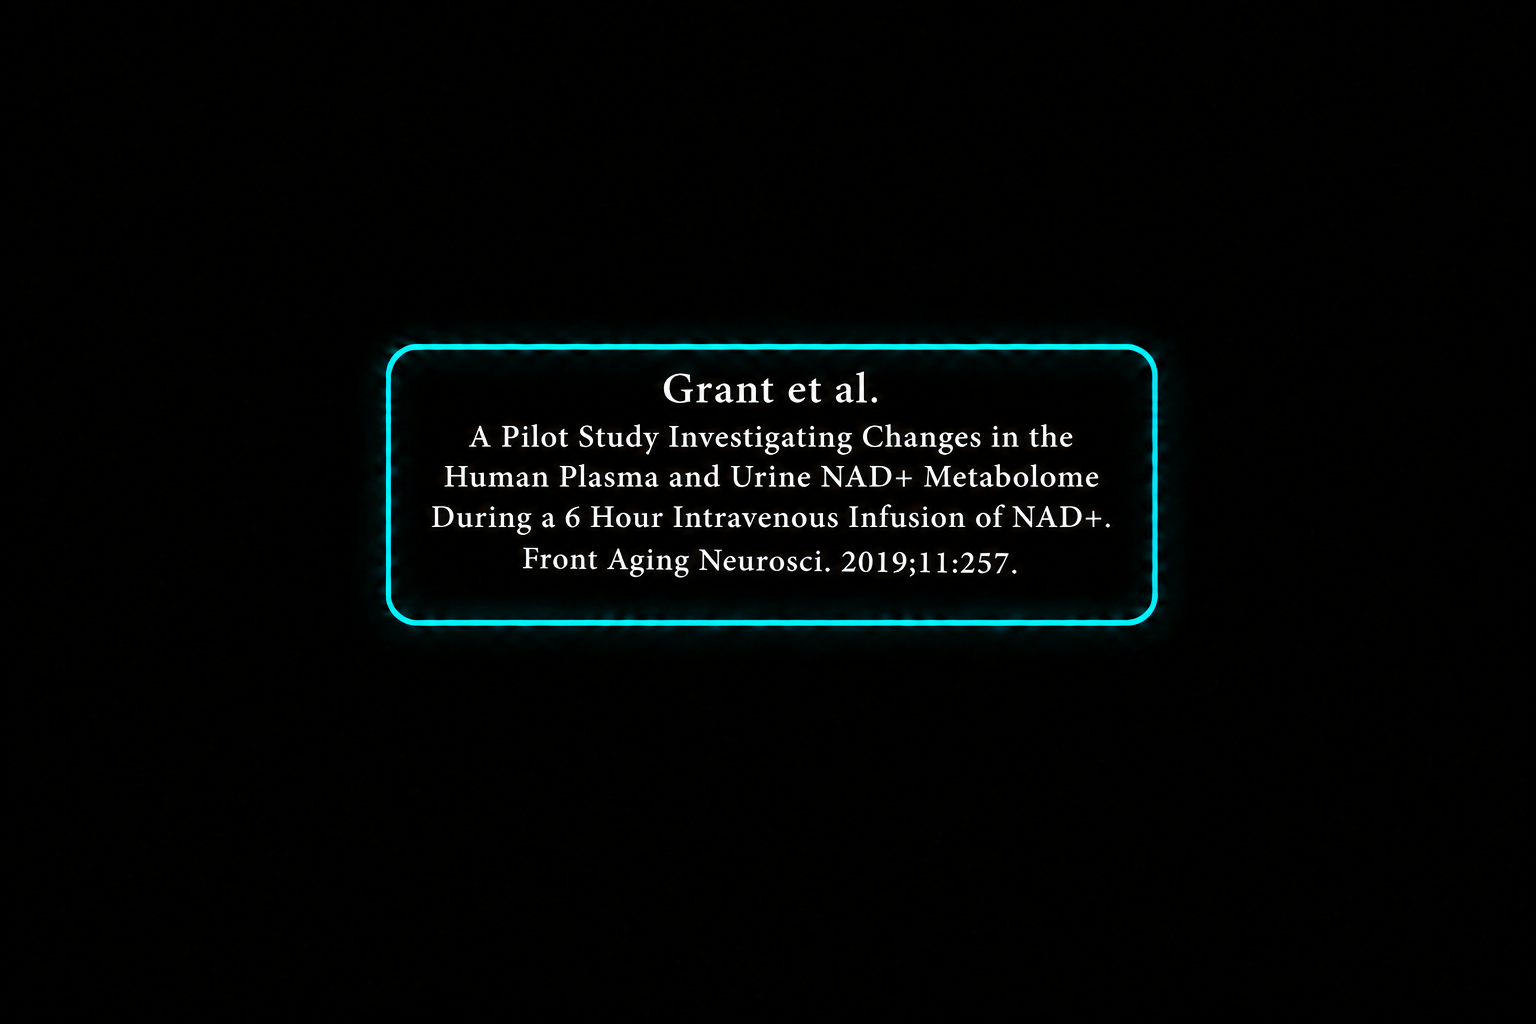
Title slide of a scientific presentation with a black background and neon blue border containing research study details on NAD+ metabolism during infusion.

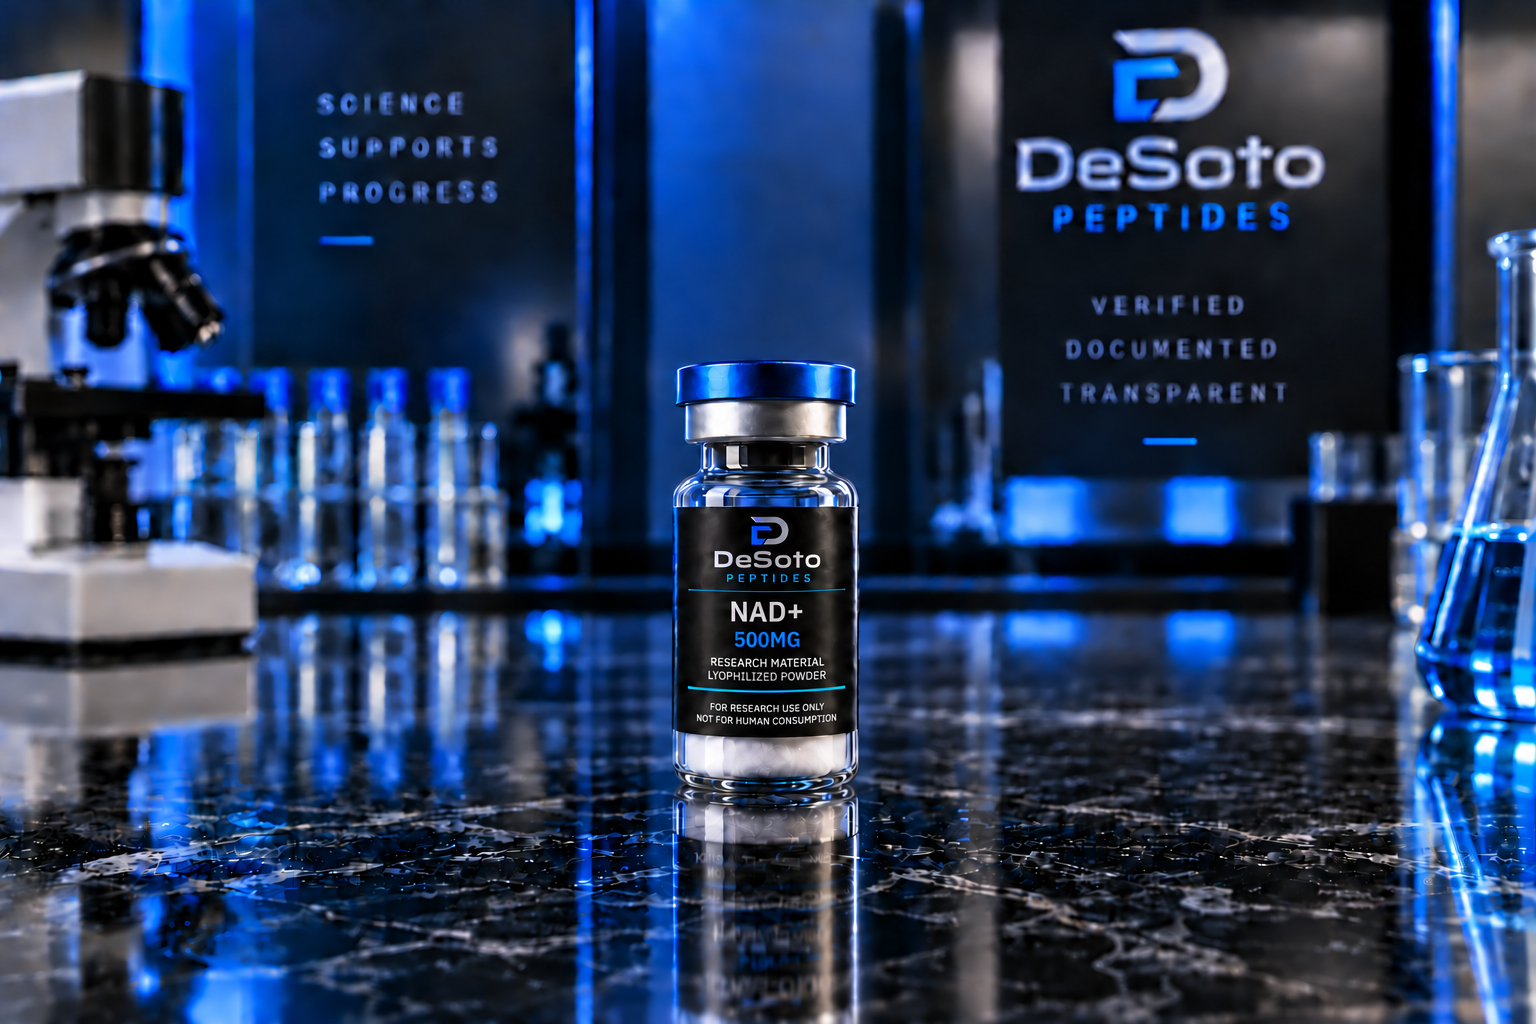
NAD+ 500/1000MG

Research material with batch-specific documentation.

For research use only. Not for human consumption